Here you can find the files for the snowline models published in the paper “Modeling snowline locations in protostars: the impact of structure of protostellar cloud cores” (Murillo, Hsieh & Walsh, 2022, A&A, 665, A68) The files can also be found at CDS. If you use the data from the model grid, or any of the images below, please cite the above paper.
Send me an email if you are interested in collaboration (nmurillo_at_starformation_dot_space).
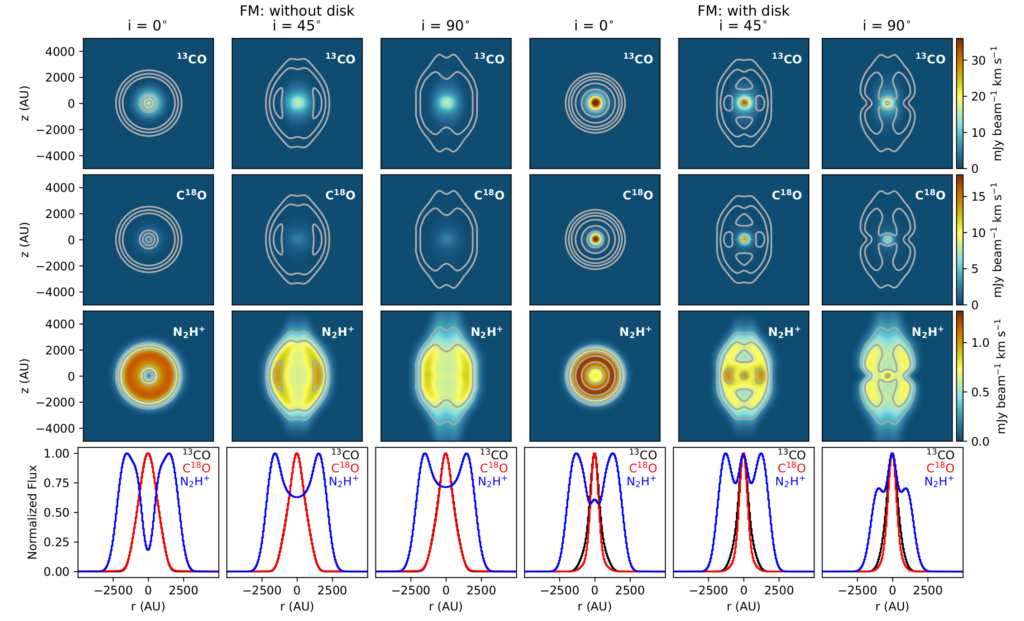
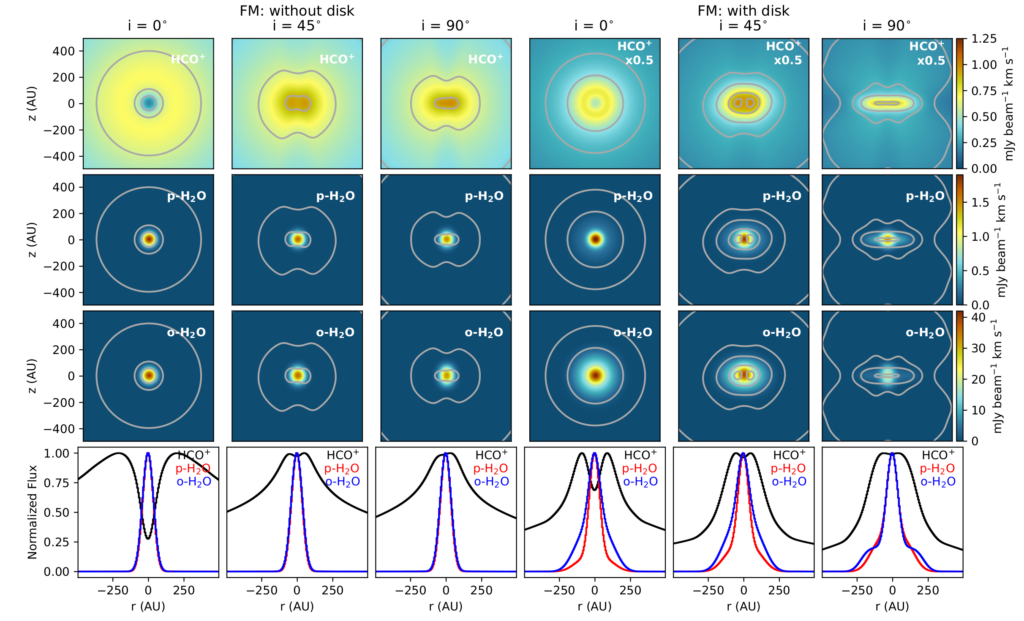
The two figures below show simulated emission integrated intensity maps for several molecules obtained from the two fiducial models (without disk, with disk; Lbol = 10 Lsun, Rdisk = 150 au, Mdisk = 0.05 Msun).
The full model grid will be available from this site. For each combination of parameters, the following files are available:
- Calculated molecular distributions of the species included in the chemical network used. Molecular distributions are provided as ascii tables, and include gas temperature and H2 density profiles.
- Simulated emission cubes of N2H+ 1-0 and HCO+ 3-2 in fits format, one cube for each inclination: 0° (face-on), 15°, 25°, 45°, 65°, 75°, 90° (edge-on).
- Spectral energy distribution (SED) of the model at each inclination
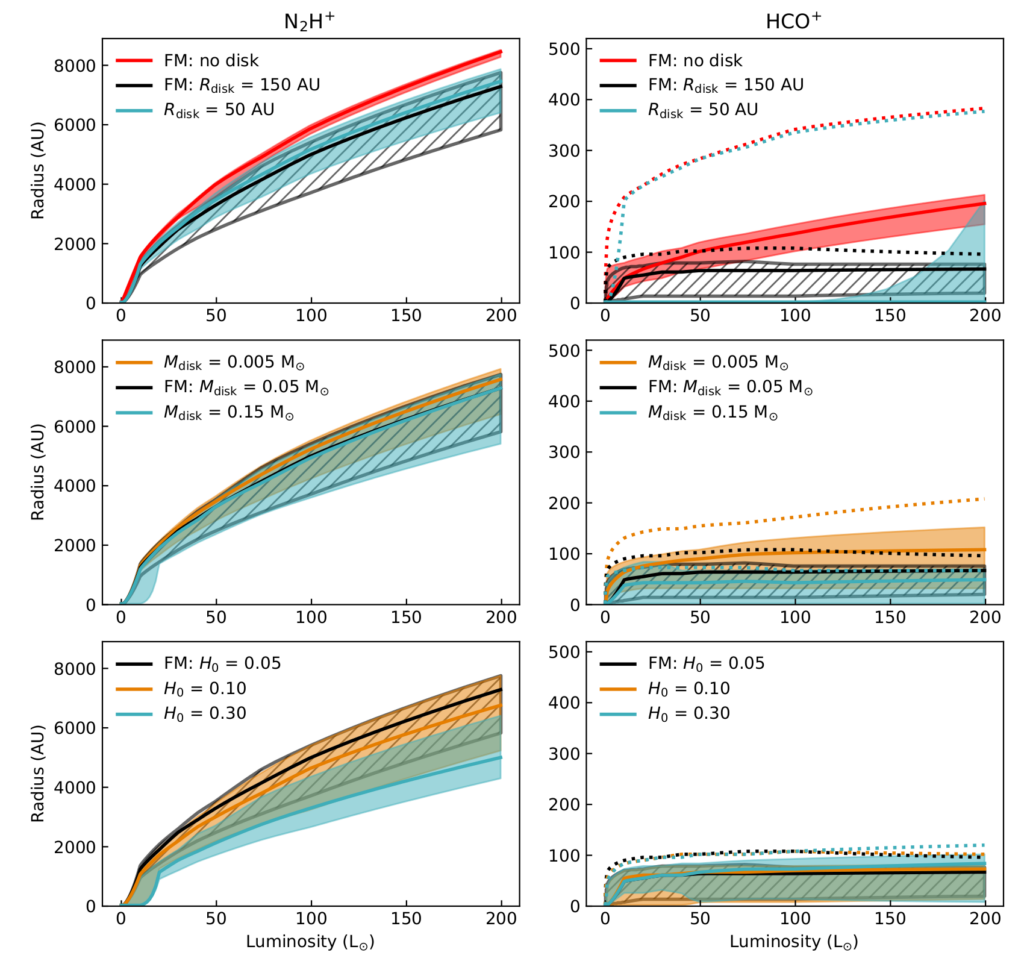
- Peak positions of N2H+ 1-0 and HCO+ 3-2 versus luminosity for each set of models with the same parameters. An example is shown in the figure below.
This site is under construction. Currently, the calculated molecular distributions and peak positions of N2H+ 1-0 and HCO+ 3-2 versus luminosity tables for the fiducial models are provided here. More will come soon.